Sparse Subspace Clustering by Multiple Candidates OMP
Algorithm
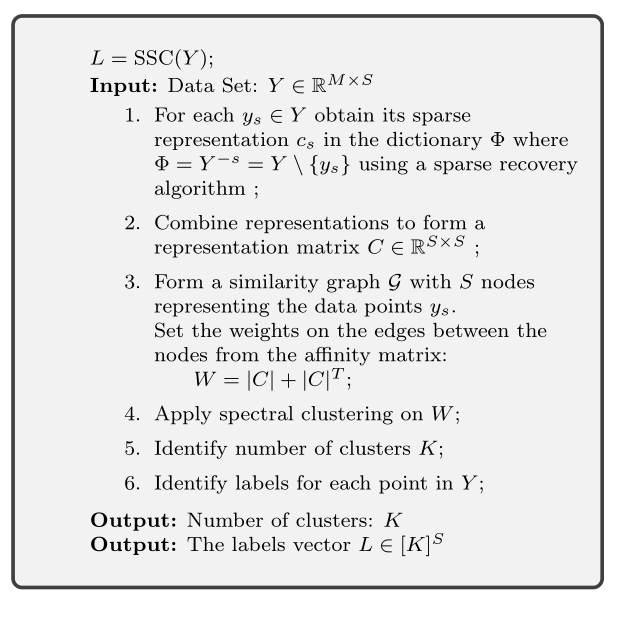
The overall SSC algorithm is reproduced in the figure below.
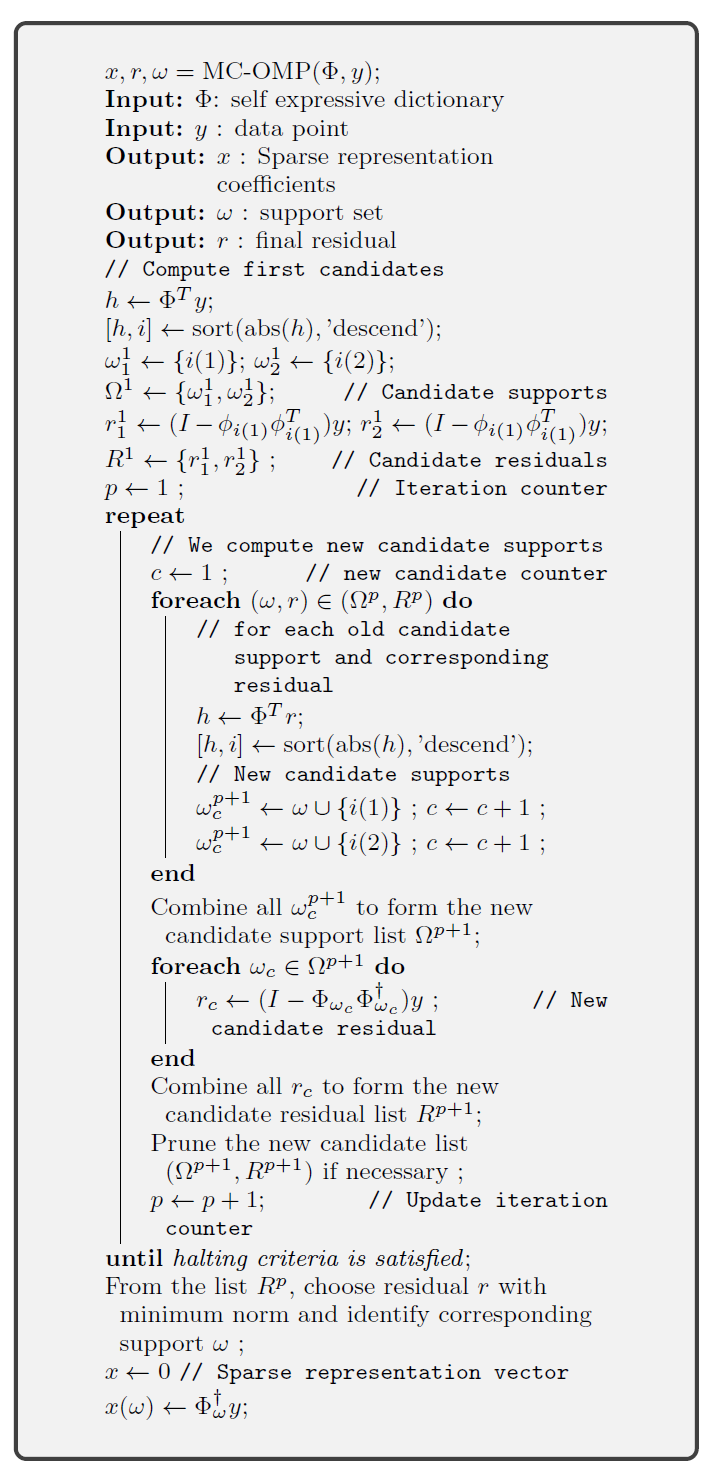
The sparse representations are computed using the multiple candidates version of OMP. This algorithm is presented below.
This section discusses a new algorithm SSC-MC-OMP.
Benchmarks
MNIST dataset
For more information about sparse subspace clustering on MNIST dataset, see Sparse Subspace Clustering with MNIST Digits.
Here we report the benchmarks using the SSC-MC-OMP algorithm.
Clustering Accuracy a%
| Images per Digit | 1-4 | 2.1-4 | 42.1-4 | 2-4 |
|---|---|---|---|---|
| 50 | 82.18 | 82.87 | 82.68 | 83.81 |
| 80 | 87.39 | 87.14 | 85.34 | 86.82 |
| 100 | 87.20 | 87.47 | 86.75 | 89.17 |
| 150 | 89.16 | 89.15 | 88.06 | 89.09 |
| 200 | 89.68 | 90.23 | 88.17 | 88.31 |
| 300 | 92.19 | 91.18 | 87.80 | 91.89 |
| 400 | 91.13 | 91.52 | 90.16 | 91.50 |
Subspace Preserving Representation Error e%
| Images per Digit | 1-4 | 2.1-4 | 42.1-4 | 2-4 |
|---|---|---|---|---|
| 50 | 42.11 | 41.63 | 41.46 | 41.00 |
| 80 | 39.79 | 39.10 | 38.85 | 38.19 |
| 100 | 38.86 | 38.12 | 37.80 | 37.06 |
| 150 | 37.33 | 36.56 | 36.11 | 35.19 |
| 200 | 36.39 | 35.50 | 34.99 | 34.00 |
| 300 | 35.18 | 34.15 | 33.59 | 32.60 |
| 400 | 34.26 | 33.26 | 32.70 | 31.57 |
Time t
| Images per Digit | 1-4 | 2.1-4 | 42.1-4 | 2-4 |
|---|---|---|---|---|
| 50 | 2.07 | 3.26 | 5.95 | 9.22 |
| 80 | 3.57 | 6.22 | 11.67 | 15.77 |
| 100 | 4.71 | 8.39 | 15.88 | 20.61 |
| 150 | 8.97 | 15.98 | 30.88 | 37.71 |
| 200 | 13.50 | 24.94 | 48.13 | 57.25 |
| 300 | 30.50 | 56.81 | 120.77 | 121.76 |
| 400 | 50.38 | 95.76 | 177.78 | 192.57 |
Observations
- Second column represents the performance of SSC-OMP algorithm.
- Other columns represent the performance of SSC-MC-OMP algorithm for various branching strategies.